
Data is not just a mere byproduct of business operations. It is the fuel that powers them.
Some companies are built entirely on data collection and analysis, while others use vast datasets to identify trends, gain insights, and predict future outcomes. However, the sheer volume of data necessitates a strategic approach. Businesses must grasp key technical data terminology, define clear data analytics and business intelligence objectives, and understand how to translate insights into tangible growth.
Data Analytics vs. Business Intelligence
“Data Analytics” and “Business Intelligence” (BI) are often used interchangeably, but they serve different purposes. Both aim to enhance decision-making, but their methodologies differ. Data Analytics employs statistical and computational techniques to extract insights from raw data. Conversely, BI focuses on organizing and presenting data to empower strategic decision-making by business leaders.
Understanding the difference is important for companies seeking to unlock the competitive potential of their data.
Data Analytics
The Four Pillars of Data Analytics
Data analytics isn’t a one-size-fits-all approach. Businesses use distinct types of analytics to extract specific insights and drive strategic decisions.

- Descriptive Analytics–
This focuses on summarizing historical data to reveal what has already happened. Think of it as creating a clear picture of past performance through key metrics like sales reports, website traffic, and customer satisfaction scores.
- Diagnostic Analytics–
This delves deeper, investigating the root causes behind past events. By analyzing patterns and relationships, businesses can understand why certain outcomes occurred. Examples include analyzing customer churn, product defects, or employee turnover.
- Predictive Analytics–
Using statistical models and machine learning, predictive analytics aims to anticipate future trends and outcomes. This helps businesses identify potential risks and opportunities through applications like demand forecasting, fraud detection, and customer lifetime value prediction.
- Prescriptive Analytics–
This goes beyond prediction, providing actionable recommendations for achieving desired outcomes. It uses data to suggest optimal strategies, such as supply chain optimization, pricing adjustments, and targeted marketing campaigns.
The Journey From Raw Data to Actionable Insights
Data analytics is a systematic process that transforms raw data into valuable intelligence.
1. Data Collection
The process begins with collecting data from diverse sources, including databases, spreadsheets, online interactions, and sensor readings. Collected data is then stored in a structured format within databases or data warehouses for efficient analysis.
2. Data Cleaning
Collected data often contains errors and inconsistencies. The process involves eradicating duplicates, rectifying errors, and standardizing formats to ensure data quality.
3. Data Analysis
Cleaned data is analyzed using statistical and computational techniques, such as regression analysis and machine learning. The goal is to identify patterns, trends, and relationships that provide meaningful insights.
4. Data Visualization
Analytical findings are translated into visual representations, such as graphs and charts. Visualization enhances understanding and facilitates the communication of complex insights.
5. Data Interpretation
The final stage involves interpreting the visualized insights and translating them into actionable strategies. These insights are used to improve business operations, optimize products, and enhance services.
Data Analytics in Action
- Retail- Understanding the Customer
Retailers analyze customer transaction data to identify popular products and optimize store layouts. Social media analysis helps gauge customer sentiment and refine marketing campaigns. The goal is to personalize offerings and boost sales.
- Healthcare- Improving Patient Outcomes
Electronic Medical Records (EMR) are analyzed to identify patient trends and inform treatment decisions. Predictive analytics helps identify patients at risk for chronic diseases, enabling early intervention. This leads to better diagnoses and more effective treatments.
- Finance- Managing Risk and Detecting Fraud
Financial institutions use predictive analytics to detect and prevent fraudulent transactions. Customer behavior analysis allows for personalized product and service offerings. This strengthens security and improves customer experience.
- Manufacturing- Optimizing Production
Sensor data from industrial equipment is used for predictive maintenance, minimizing downtime. Predictive analytics helps identify quality issues early, ensuring consistent product quality. This increases efficiency and reduces costs.
- Transportation- Enhancing Efficiency and Safety
GPS data optimizes delivery routes, reducing fuel costs and delivery times. Predictive analytics identifies potential safety hazards, enabling proactive accident prevention. This makes transportation safer and more efficient.
Business Intelligence

The Evolution of Business Intelligence
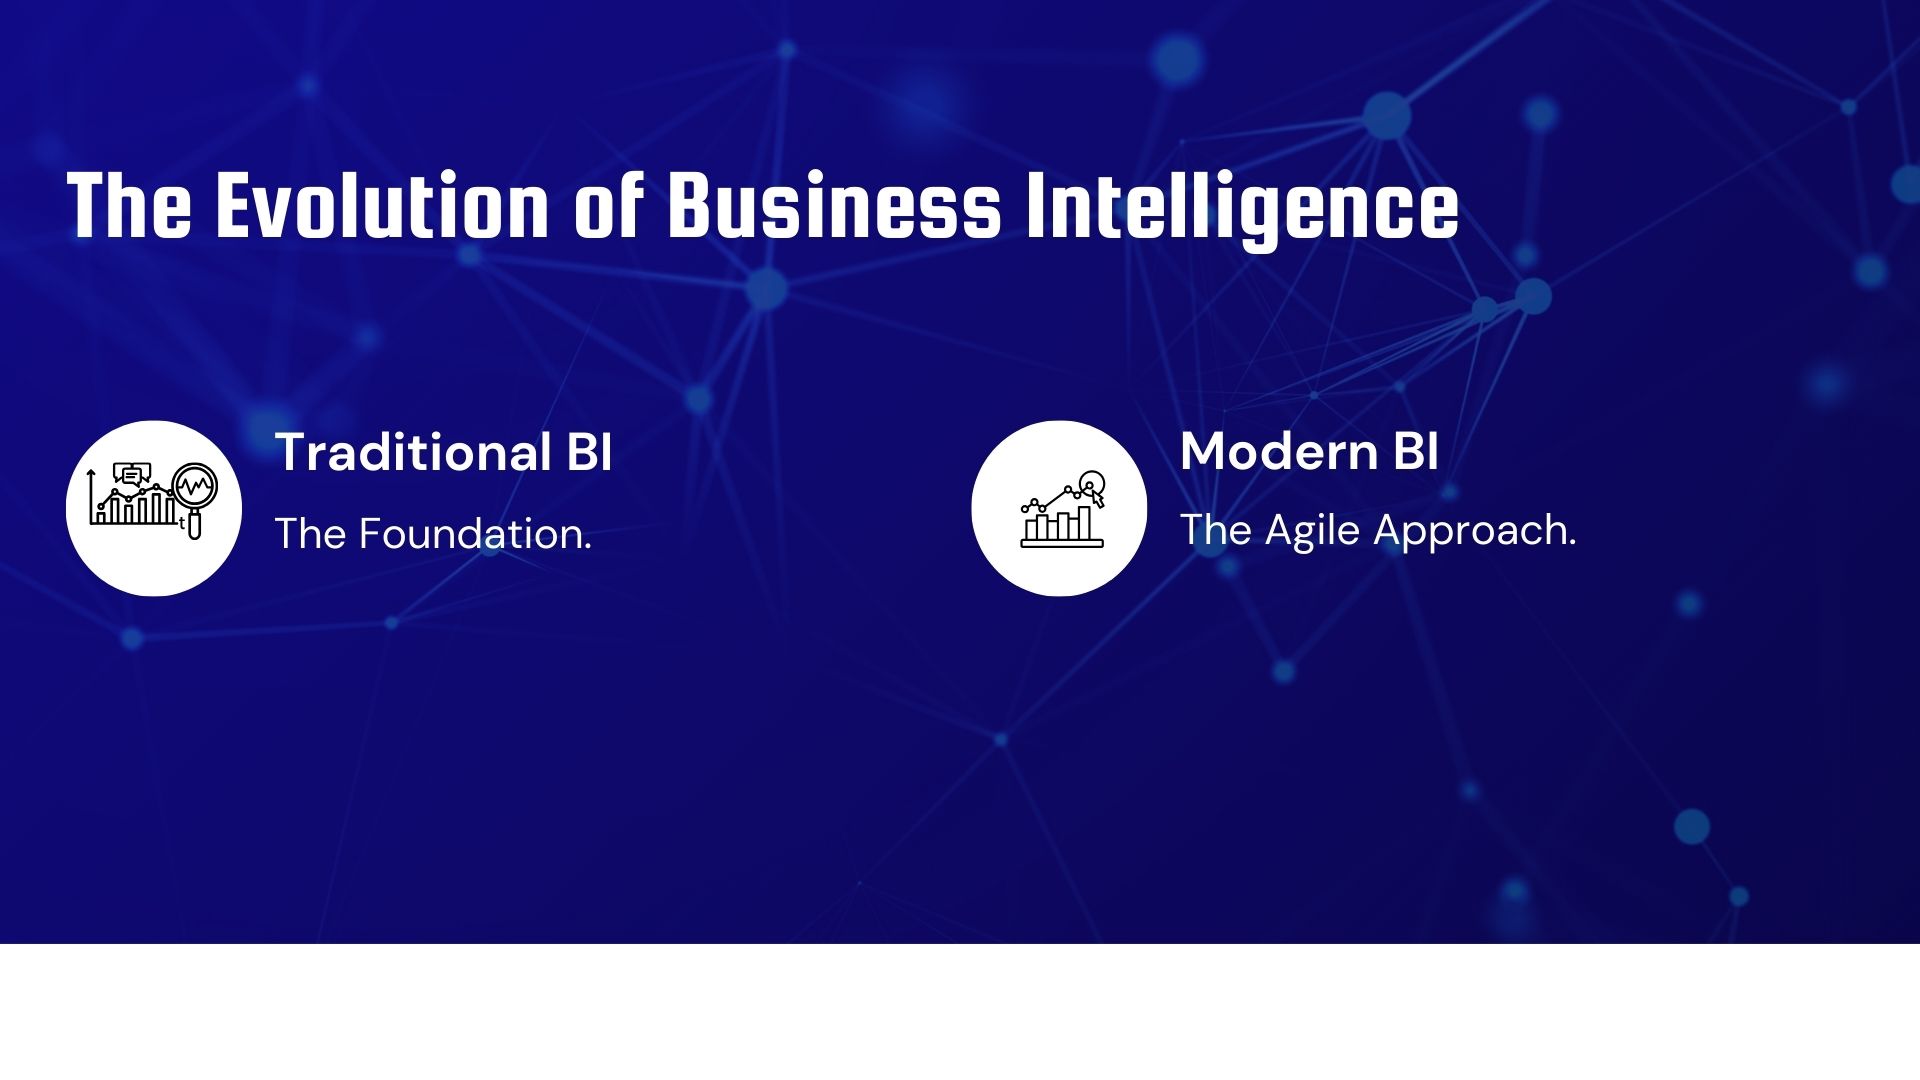
- Traditional BI-
This approach relies on structured data from internal sources like sales, finance, and inventory. Data is typically stored in data warehouses and analyzed using SQL-based tools, such as OLAP cubes, for reporting and dashboard creation. Traditional BI excels at providing reliable, structured insights for established reporting needs, such as financial analysis and operational performance monitoring.
- Modern BI-
Modern BI leverages technological advancements to offer real-time, self-service access to diverse data sources. It empowers users with interactive dashboards, visualizations, and natural language queries, enabling them to explore data independently. Furthermore, modern BI incorporates machine learning for automated data preparation, discovery, and analysis, revealing insights from complex datasets. Key features include data discovery, self-service analytics, real-time reporting, and predictive capabilities.
Bridging the Gap
While traditional BI offers stability and established reporting, modern BI provides flexibility and agility. Integrating both approaches allows organizations to gain a comprehensive view of their operations. This synergy allows for both reliable, structured reporting and dynamic, real-time analysis, ultimately leading to more informed decisions and a stronger competitive position.
Transforming Data into Strategic Action
Business Intelligence (BI) empowers organizations to make data-driven decisions by systematically converting raw data into actionable insights.
a. Data Collection
BI tools gather data from diverse sources, including transactional databases, CRM systems, and social media platforms. This data is typically centralized within a data warehouse, optimized for efficient reporting and analysis.
b. Data Integration
Collected data is integrated into a single, consistent source. This involves cleaning, validating, and harmonizing data from multiple sources to ensure accuracy and reliability.
c. Data Analysis
Integrated data is analyzed to identify trends, patterns, and key insights. This stage involves creating reports, dashboards, and visualizations, and may also leverage advanced analytics techniques like data mining and machine learning.
d. Data Presentation
Analyzed data is presented in user-friendly formats, such as charts, graphs, and interactive dashboards. This enables business users to easily understand and interpret the data, regardless of their technical expertise.
e. Actionable Insights
The insights derived from the analysis are translated into actionable strategies. These strategies inform key business decisions related to product development, marketing campaigns, supply chain optimization, and other critical areas. Effectively implementing BI helps organizations gain a comprehensive understanding of their operations, identify opportunities and mitigate risks, and ultimately optimize their overall performance.
Business Intelligence in Practice
- Sales Performance Optimization
BI tools analyze sales data across regions, products, and channels to identify top performers and areas for improvement. This enables strategic decisions on product placement, sales strategies, and channel optimization.
- Financial Health Monitoring
Real-time financial dashboards and reports provide a clear view of financial performance. This allows businesses to promptly identify and address financial anomalies and optimize resource allocation.
- Customer Experience Enhancement
BI analyzes customer data to understand behavior and preferences, enabling personalized product offerings and targeted marketing. This results in improved customer satisfaction and loyalty.
- Supply Chain Efficiency
BI tools monitor and optimize supply chain processes, identifying bottlenecks and improving inventory management. This leads to reduced costs and faster delivery times.
- Operational Excellence
BI tracks key performance indicators (KPIs) like productivity and quality, providing insights for operational improvements. This enables businesses to streamline processes and enhance overall efficiency.
- Future Trend Prediction
Predictive analytics within BI uses historical data to forecast future trends, such as demand and potential risks. This empowers proactive decision-making and strategic planning.
- Social Media Engagement
BI analyzes social media data to understand customer sentiment and identify emerging trends. This allows businesses to adapt marketing strategies and enhance customer engagement.
The Evolution of Analytics and Intelligence
The fields of Data Analytics and Business Intelligence have undergone a remarkable transformation over the decades, mirroring the evolution of computing itself.
- The Dawn of Data Processing (1960s-1980s)
Early computing focused on automating manual tasks, with mainframes handling large datasets. The development of relational databases in the 1970s and 80s improved data organization, but analysis remained limited. Data’s primary role was record-keeping, not insight generation.
- The Rise of Decision Support (1980s-1990s)
Businesses began to recognize data’s potential for decision-making. Decision Support Systems (DSS) emerged, providing analytical tools for executives and managers. These systems marked a shift towards using data for strategic insights.
- The Emergence of Data Warehousing and BI (1990s-2000s)
Data warehousing revolutionized data storage, enabling large-scale analysis. Data mining techniques were developed to extract valuable insights from these warehouses. Business Intelligence (BI) tools streamlined data analysis and visualization, making insights accessible through reports and dashboards.
- The Era of Big Data and Advanced Analytics (2000s-Present)
The internet and digital proliferation led to an explosion of data, ushering in the “Big Data” era. Platforms like Hadoop enabled the processing of massive datasets. Advanced analytics, including machine learning and predictive modeling, provided deeper insights. The current landscape emphasizes real-time analysis, self-service BI, and the integration of artificial intelligence, driving data-driven decision-making.
Distinctions Between Data Analytics And Business Intelligence
While both Data Analytics and Business Intelligence (BI) use data, they serve distinct purposes and employ different methodologies.
DATA ANALYTICS | BUSINESS INTELLIGENCE | |
SCOPE | Explores complex datasets to discover patterns, trends, and insights, often with a broader, more exploratory focus. | Monitors business performance and facilitates informed decisions through structured reporting and dashboards. |
TECHNIQUES | Employs advanced techniques like data mining, predictive modeling, and machine learning for in-depth analysis. | Relies on dashboards, reports, and visualizations for user-friendly communication of insights. |
PURPOSE | Aims to uncover insights and identify opportunities for business improvement through in-depth analysis. | Provides decision-makers with timely information to support day-to-day operations and strategic planning.
|
TIME PERIOD | Focuses on long-term, strategic insights through historical data analysis and predictive modeling. | Emphasizes short-term, tactical insights through real-time or near-real-time performance monitoring. |
AUDIENCE | Primarily used by data analysts and data scientists with specialized technical skills. | Designed for a wider audience, including managers, executives, and front-line employees. |
DATA TYPES | Often handles unstructured or semi-structured data from diverse sources. | Primarily works with structured data from databases and data warehouses.
|
COMPELXITY | Deals with complex datasets requiring advanced analytical skills and tools.
| Focuses on simpler, more intuitive tools for report and dashboard creation. |
DATA SOURCES | Pulls data from multiple diverse sources.
| Typically focuses on data from single, structured sources.
|
GRANULARITY | Analyzes data at a granular level to identify detailed patterns.
| Aggregates data for high-level summary reports and dashboards.
|
FOCUS | Answers open-ended questions and explores data for hidden patterns.
| Answers specific business questions for direct decision-making. |
DATA VOLUME | Handles large volumes of data, including big data. | Works with smaller, more manageable data volumes.
|
TECHNICAL SKILLS | Requires specialized skills in data mining, machine learning, and programming. | Requires less specialized skills, focusing on data visualization and reporting.
|
GOAL | Drives better business decisions through insightful data exploration.
| Improves business performance through timely and accurate information.
|
TOOLS | Uses specialized tools and programming languages like R, Python, and SQL. | Employs user-friendly tools like Tableau, Power BI, and Excel.
|
The question isn’t “which is better,” but rather “how can they work together?”
Data Analytics and Business Intelligence (BI) are not competing entities, but complementary forces that empower data-driven decision-making. In a successful data strategy, these two approaches work in tandem. The ideal approach depends on your specific business needs, data volume, and strategic goals. Smaller businesses may focus on BI for immediate performance monitoring, while larger enterprises may invest heavily in Data Analytics for long-term strategic insights.
Ultimately, the most effective organizations use both Data Analytics and BI, creating a comprehensive view of their operations and fostering a culture of data-driven decision-making.
They both are tools in the data toolbox, and should be used when the situation calls for it.
References
https://www.fivetran.com/learn/data-analytics-vs-business-intelligence
https://careerfoundry.com/en/blog/data-analytics/business-intelligence-vs-data-analytics/
https://www.geeksforgeeks.org/difference-between-business-intelligence-and-data-analytics/DAT